Financial briefing
Turn results into a financial narrative
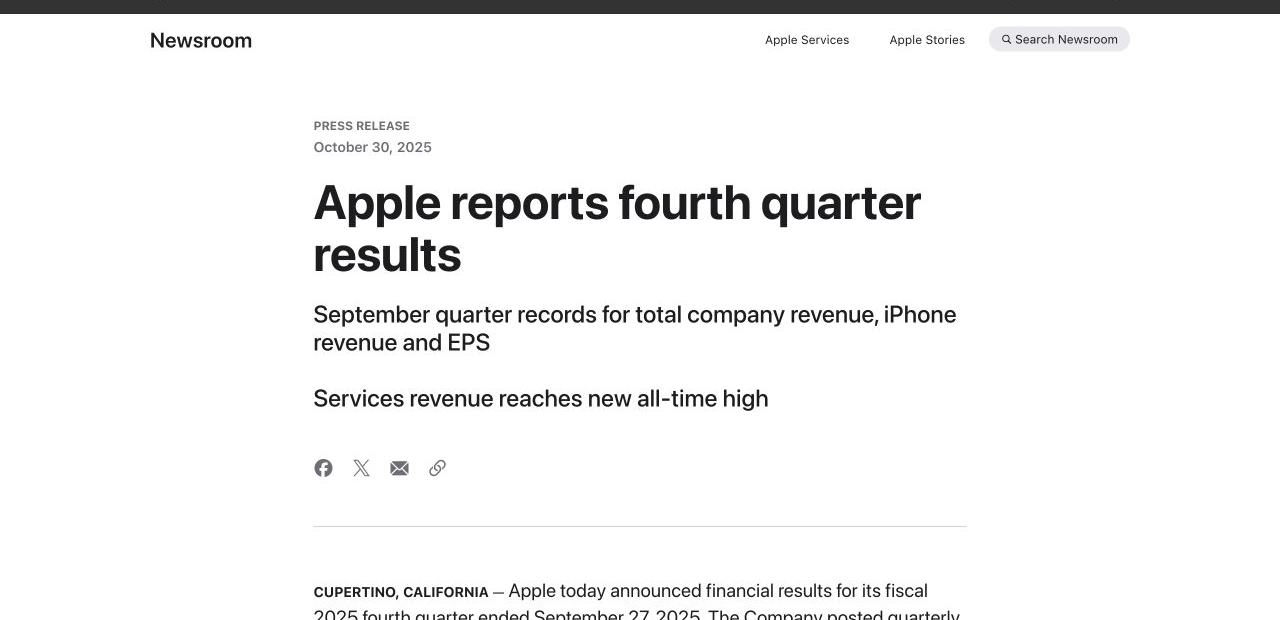
What you want to explain
A report or spreadsheet should become a data story with a decision or audience in mind—not a table on screen.

Start with PDFs, PowerPoint decks, Word documents, Excel data, technical diagrams, research, or web links. Turn the source into an explainer, training walkthrough, or course lesson—up to 30 minutes in one generation.
Financial briefing
What you want to explain
A report or spreadsheet should become a data story with a decision or audience in mind—not a table on screen.
Engineering explainer
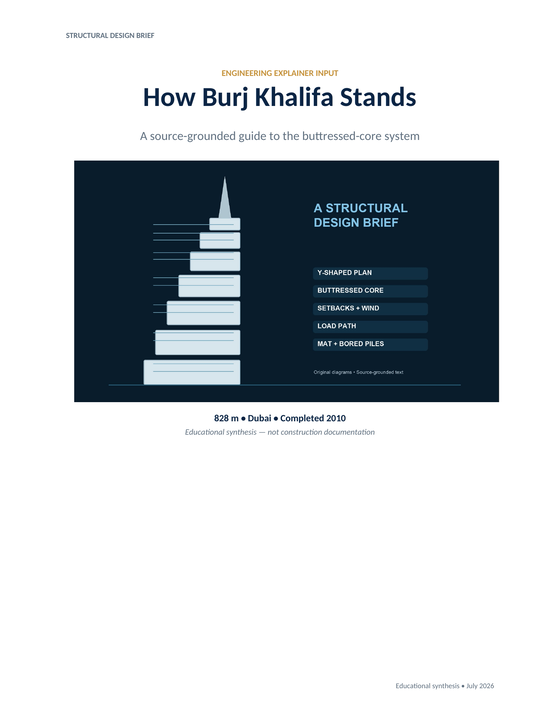
What you want to explain
A Word document contributes headings, relationships, and technical terms that can become the structure of the video.
Professional education

What you want to explain
A PDF can support a visual explanation when you keep the important sequence of information clear for the viewer.
You want a report, spreadsheet, or KPI update to become a briefing people can understand before the meeting begins.
You need handbooks, SOPs, and policy documents to help new teammates get moving, not sit unread in a folder.
You want a paper, chapter, chart, or diagram to open up for someone seeing the topic for the first time.
You want to use manuals, design documents, and diagrams to show how something works—not simply describe it in another file.